Executive Summary
01. The Context
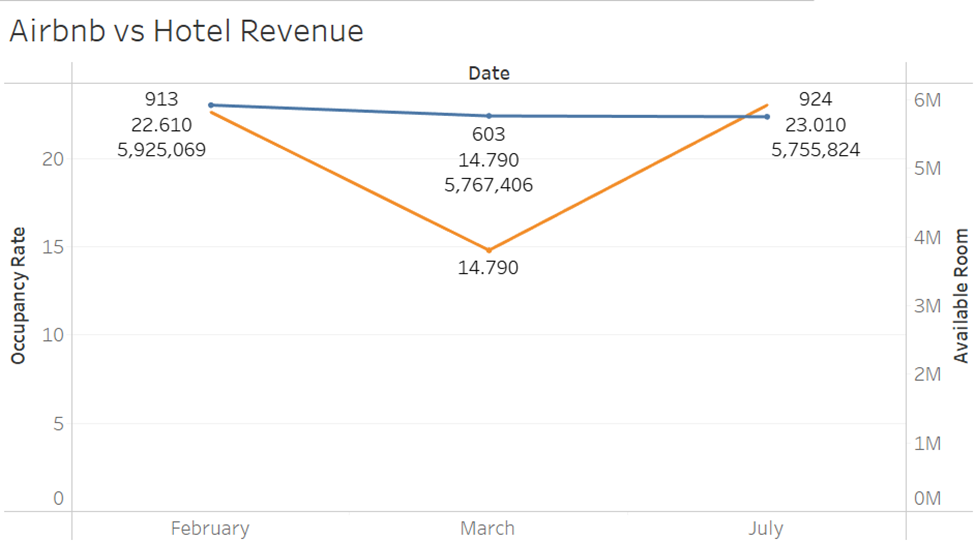
Legacy Blindspot: Stakeholders lacked unified metrics to benchmark performance across distinct asset classes (Fixed Hotel Inventory vs. Variable Airbnb Listings). This created a "yield gap" during high-demand periods.
02. The Action
Forensic Engineering: Engineered a proprietary Tableau dashboard to filter 116,000+ data points. Isolated "Guest Type" behaviors to correct the "Revenue vs. Rate" fallacy and map true demand drivers.
03. The Result
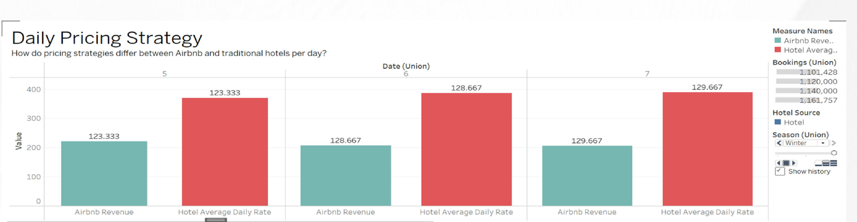
Strategic Nuance:
Validated that Hotels command a "Reliability Premium" ($129 ADR) compared to Airbnb's
"Leisure Flexibility" ($123).
Crucial
Insight: While distinct, competitive overlap spikes during Peak Seasons,
requiring distinct yield strategies rather than a blanket price war.